The Add Shapes Section contains a number of utilities to add Clip Art and custom shapes.
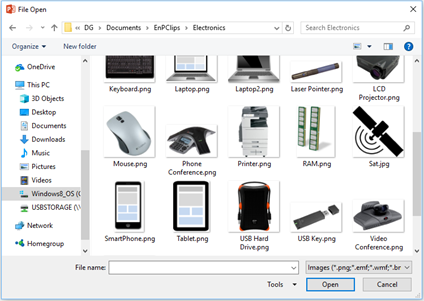
 EnP Clips: Allows the user to insert an images and Clip Art found in specific folders located in user's Documents\EnPClips folder. The user can add their own "favourite" images to the exiting folder(s) or add their own folder(s) to the user's Documents\EnPClips folder. EnP Tools comes with a few examples to get you started.
Examples:
The Custom Shapes menu has 3 specialized functions to add different shapes.
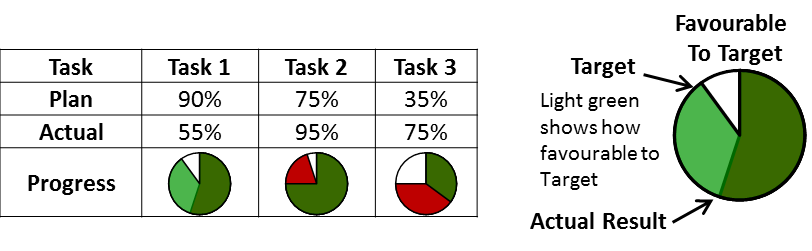
 Progress Pies can be used to report on the progress of a task or activity.
Greater is Favourable: From the selected range of Actuals, returns circular representations of task completion rates based on Plan vs Actual where Actual greater than Plan is favourable. The Progress Pies are pasted to the right or below the selected cells. Targets must be in the adjacent cells above or to the left of the Actuals - both to be entered as percentages.

Less is Favourable: From the selected range of Actuals, returns circular representations of task completion rates based on Plan vs Actual where Actual less than Plan is favourable. The Progress Pies are pasted to the right or below the selected cells. Targets must be in the adjacent cells above or to the left of the Actuals - both to be entered as percentages.
Progress Pie Black: From the selected range of Actuals, returns black circular representations of task completion rates. The Progress Pies are pasted to the right or below the selected cells. The Actuals are to be entered as percentages.
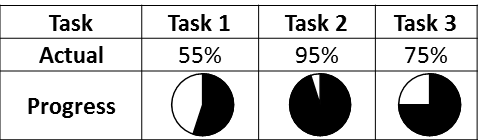
NOTE: Functions will work with horizontal or vertical ranges. Single cell selections will place the Progress Pie to the right.
Misc Shapes
 Add Time Line: Adds or deletes a grouped shape - reverse "S" time line graphic.

 Rounded Rectangle: Adds a red Rounded Rectangle that can be used to indicate focus areas.

 Callout: Adds a red Rounded Callout that can be used to indicate focus areas.

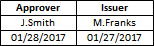
 Approval Box: Adds a Approval sign off box at the current cell location. The first blank cells are intended for the names and the second row for the dates.
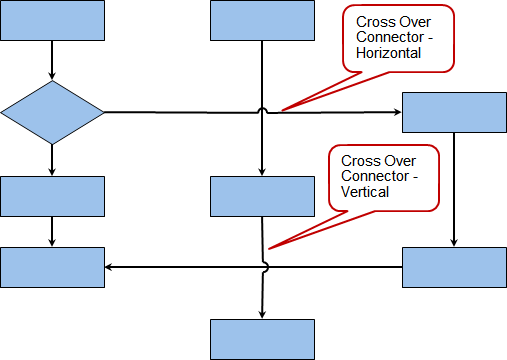
 Cross Over Connector - Horizontal
 Cross Over Connector - Vertical: Adds a set of connectors that can be used in flow charts for cross overs. It adds 3 joined MS Office shapes – a straight connector, an arc and a straight line arrow. The straight connector and arrow are meant to be connected to the flow chart symbols. The arc is best moved with the keyboard arrow keys – up and down, side to side. The same connectors are available in Excel.
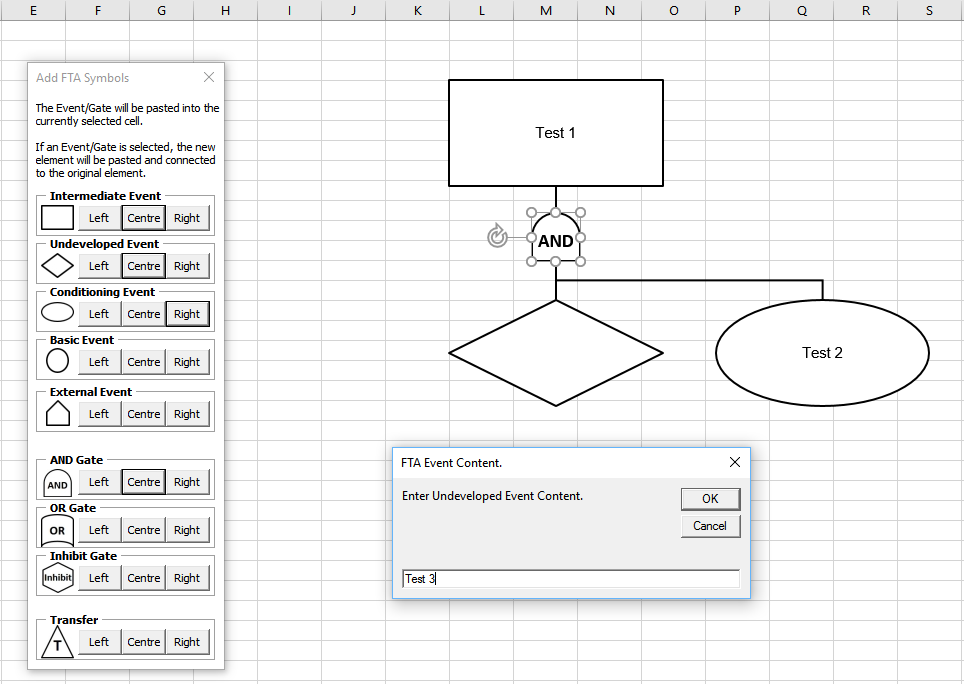
FTA Symbols: Displays a form from which the User can add symbols to build an FTA chart. The Event/Gate will be pasted into the currently selected cell. If an Event/Gate is selected, the new element will be pasted and connected to the original element.
 Yamataka Tools: A set of tools to help build Yamataka / Waterfall charts from simple rectangles:
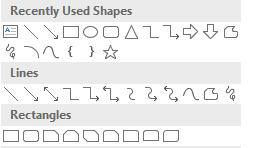
 Add Shapes and Connectors: Displays the MS Office Autoshapes gallery. Right clicking on a shape and selecting “Lock Drawing Mode” will allow the User to draw multiple versions of the selected shape.
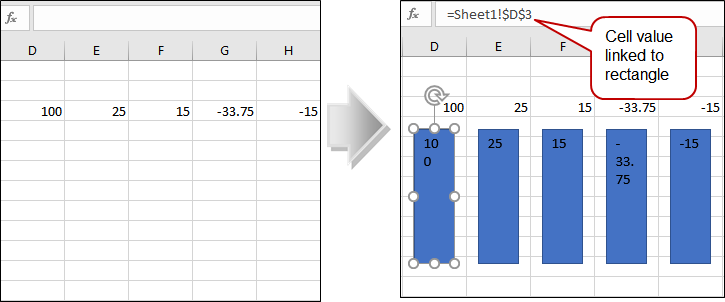
 Add Linked Rectangles: Adds rectangles with text linked to the cell values of the selected range. If the range is horizontal, the rectangles will be placed beneath the selected range as below. If the range is vertical, the rectangles are placed to the right of the range. These rectangles can be used to start the Yamataka building process.
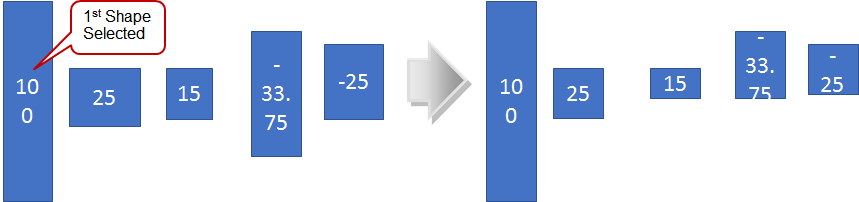
 Size Proportional: Proportionately sets the height of the selected shapes in relation to the height of the first selected shape and its text while setting the width to be the same as the first shape.
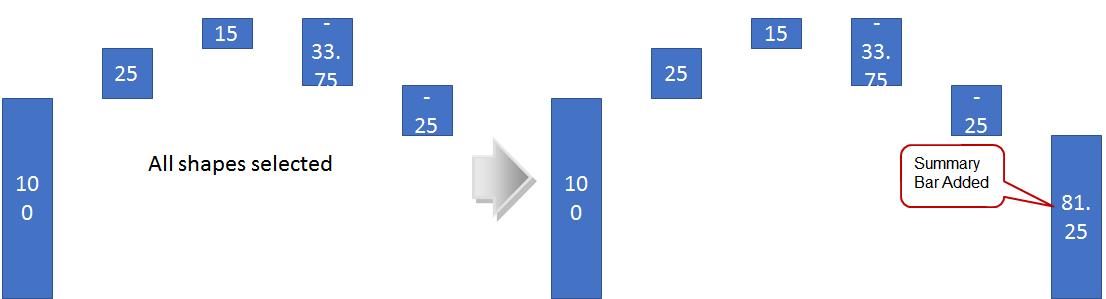
 Cascade: Arranges the selected shapes (beginning with the first selected shape) into the basic cascade arrangement of a Yamataka or Waterfall chart. It takes into account whether or not the values in the rectangles are positive or negative and aligns the shapes appropriately. It also horizontally spaces the shapes based on the width of the first shape.

 Add Summary Bar: Creates a rectangle with the sum of the values of the selected shapes as it's text value, sets the height and width relative to the 1st selected shape then aligns it's bottom to that shape.
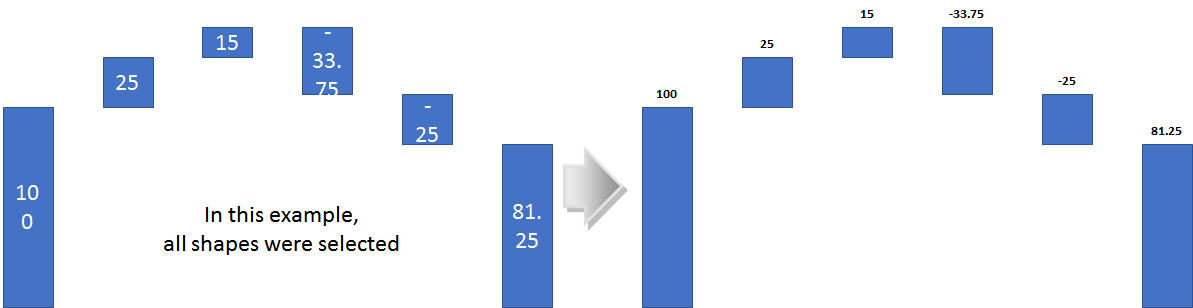
 Move Text Above: Creates a text box above the selected rectangle with the rectangle's text and then deletes the original text in the rectangle.
 Erase Shapes: Erases All Shapes (pictures, graphs, textboxes, autoshapes, etc...) in the selected range.