Problem Tracking Charts:
The functions provided in this section provide 3 ways to create PowerPoint slides from a row in a specially formatted Excel sheet. Included are 2 mechanisms to allow users to format a sheet to work with the create functions.
The simplest way to use the first 2 functions is to add the specially formatted sheet via the Worksheet Tools - Forms function: Add Problem Tracking Sheet. This function provides a basic sheet that users can immediately start using without employing the "Prep" functions described further down. Each cell in the Title row is named (e.g. PT_01) in order to determine which content goes where in the PowerPoint slide. Note: moving the columns in the spreadsheet is possible; however, the PowerPoint layout is fixed.
Create a Problem Tracking Chart: From a properly formatted sheet, this feature will copy information from the current row and create a specifically formatted PowerPoint presentation. The user will be prompted to save the presentation. A suggested file name is derived from 3 columns containing the named ranges - PT_01, PT_02 & PT_03; however, the user can choose a different name or not to save the file at that time. If the presentation is saved, a hyper-link will be created to the saved file on the exported row. The hyper-link will be attached to the value that resides in the same column as the named range PT_01 in the exported row. A single Image can be transferred but its location on the Excel sheet but in the same column as the named range PT_07. This column on the sheet created by the Worksheet Tools - Forms function: Add Problem Tracking Sheet function is cleverly titled "Image". If no images are required, the cell can be used for additional text.

Create a Problem Tracking Chart with Image Annotation: Performs as above with one exception regarding the image. Using this function transfers the contents of the cell – any image, call-out, shape, etc… as a single image. Any annotation on the image from the Excel file will transfer to the presentation; however, it will not be editable.
Create a Problem Tracking Chart from Template: Creates a PowerPoint slide from the current row from a EnP Tools problem tracking sheet using a user created template. The Excel sheet must be prepared using the tool "Prep PTC Sheet for PowerPoint Template" (see below). Also, a template file "Custom_EnP_PTC.pptx" must be in the Documents folder. The template file can be created using EnP Tools for PowerPoint under Utilities - Misc Tools: Convert to PTC Template. Images can be in any of the "mapped" Excel columns. The combination of the PowerPoint & Excel functions provides a significant level of flexibility in creating PowerPoint summary slides from Excel. Once a template is created, copying the Excel data to the template is faster than the functions above due to the fact that no rectangles are drawn and formatted.
 Prep PTC Sheet for PowerPoint: Allows the user to select columns to be exported to a PowerPoint PTC slide. Opens a form to map specific column cells to the PowerPoint Problem Tracking Chart. This allows any worksheet to be used as a source to create a PowerPoint Problem Tracking Chart. The mapped cells are set up as named ranges allowing the text to be modified and the columns rearranged while maintaining the PowerPoint output to remain the same.

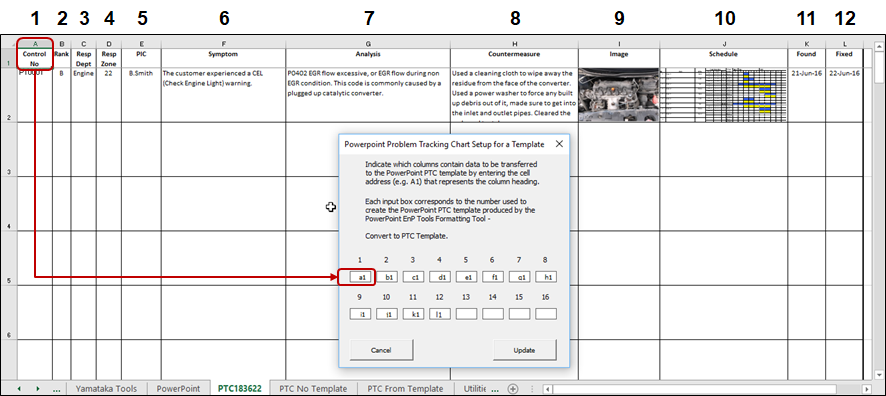
Prep PTC Sheet for PowerPoint Template: Allows the user to select up to 16 columns to be exported to a PowerPoint PTC slide utilizing the user created "Custom_EnP_PTC.pptx" template in the Documents folder. The template file can be created using EnP Tools for PowerPoint under Utilities - Misc Tools: Convert to PTC Template. Images can be in any of the "mapped" Excel columns.